| |
Standard System Reports
ORSuite ® includes comprehensive
yet flexible reporting capabilities, utilizing powerful
report engines on multiple levels; Standard System Reports, Summary User-Driven Reports and Detail Custom
Reports.
All report types can be modified by the user, exported to various formats, viewed on the screen, shared with other users, and sent to a printer.
Standard System Reports are list reports and include:
- Staff lists, including related system table data
- Clinical event lists, including related system table data
- Preference card lists, including related system table data
- Supply lists, including related system table data
- Equipment lists, including related system table data
- Implant lists, including related system table data
- Vendor and manufacturer lists, including related system table data
- Lower schedule grid data
- Master patient registry query data
- And much more…
|
Summary User-Driven Reports
Summary User-Driven Reports are more complex
than standard reports and are considered user-driven
because they are generally driven by site-specific data.
Types of Summary User-Drive Reports include:
- Schedules (daily, monthly, by surgeon, final, etc.)
- Utilization (room, staff, blocks, etc.)
- Scheduled versus Actual (times, durations, cancellations, moved, rescheduled, etc.)
- Supply pick lists (by category, location, date, case, etc.)
- Supply Costs (by case, date, period, etc.)
- Case costs (by driver, date, period, etc.)
- Turnover times (between cases)
- And much more…
Detail Custom Reports
Design of this type of report is possible by the user and available for a cost.
These reports are more complex, more detailed in nature, and can include data from multiple sources.
Features can include:
- Outcomes analysis
- Ability to save as PDF for easy distribution via
website, email, etc.
- Calculated fields
- Data from multiple sources
- Filtering by department, staff ID, etc.
- Filtering by cost drivers, including sub-categories (where applicable)
- Comparison of "what if" scenarios
- Comparison of actual outcomes versus expectations
- And much more…
Organization of Reports
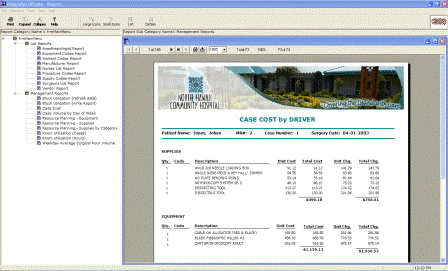
An “explorer” like interface is included for organizing reports,
schedules, documents, and other outputs into categories defined by
the user, and where they can be launched for viewing or printing. Reports
can also be linked to relevant forms located throughout the program, giving quick access for viewing and printing.
Pictured below is an example of how reports can be categorized for easy access for viewing and printing.

| | | |
|