| |
ORSuite® makes managing the daily schedule simple.
The graphic schedule screen is not only easy
to use, it provides schedulers and the
central desk a dashboard from which informed
decisions regarding the total daily schedule can
be made. Here are just a few of the features
of the graphic schedule screen.
-
Dual-Pane Graphic Schedule: The dual-pane schedule screen provides a visual
graphical representation of the daily schedule
in the upper pane as well as case
data in the lower pane.
-
User-Defined Case Data: The user controls what case
data appears in the lower schedule pane and in
what order.
-
Total Room Utilization at a Glance: The horizontal graphic representation of the
daily schedule in the upper pane provides
managers the ability to see total room
utilization at a glance.
-
Click-and-Drag Cases: The user can “Click and Drag�?scheduled cases
between time slots or from one room
to another.
-
Quickly and Easily Modify the Schedule: Toolbar
buttons can be used to quickly and easily
schedule, reschedule, or move cases, while the
lower pane provides summary data related to the
scheduled cases.
-
Reduce Downtime and Cancelled Cases: Historical case times suggested by the
system are surgeon and procedure specific, based
on more accurate estimators rather than
simple averages, and may be easily overridden by
the user.
-
Optimize Scheduling Practices: The user can search for first available time
slots based on pre-selected case criteria,
reserved block times, and preferred time
requests.
-
Avoid Oversight of Special Requests or Circumstances: Notes related to the daily schedule or a
specific case can easily be recorded from the
schedule screen.
-
Accommodates Unique Scheduling by Department: System default parameters
and user preferences can be adjusted to
accommodate individual or unique scheduling
technique.
-
Allows for Informed Decision Making: User-defined
colors can be used to designate case
status, including potential and real resource
conflicts.
-
Easily Reschedule Cases to a Different Date: A calendar control can be used
to move scheduled cases to another date.
-
Easy Access to Patient Records: Double-clicking a case opens
the chart for that patient.
-
Quick and Easy Reporting on Case Data: The case data
displayed in the lower schedule grid can easily
be sent to a printer or exported to Excel, Text, HTML, or
XML.
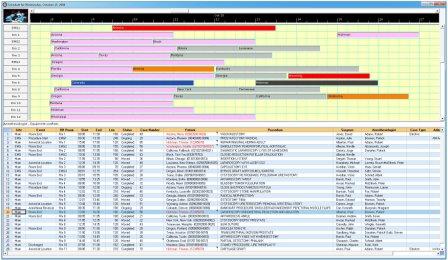
Pictured below is an example of the
graphic schedule screen. In this example, the pink
horizontal bars in the upper schedule grid represent
cases that have been completed, the blue horizontal
bar represents a case that hublot replica uk is still ongoing, the
black horizontal bar represents the case currently
selected (also highlighted in the lower
schedule grid), the gray horizontal bars represent
cases that have yet to start, the two orange
horizontal bars represent cases that have potential
conflicts with one or more of the cases, and the two
red horizontal bars represent cases that have actual
conflicts with one or more of the cases.

Each row of the upper schedule grid represents an
operating room and the room names are located on the
buttons to the left of each row. The lower schedule
grid contains columns of case data associated with
each case displayed in the upper schedule grid. The
user controls what data columns are displayed in the
lower schedule grid, and cartier replica uk can include data such as
room, start time, end time, case duration, surgeon,
procedure, anesthesiologist, patient name, patient
ID, case status, and more. By right-clicking the
upper-left corner of the lower grid, the
case data can be sent to a printer or exported to
Excel, Text, HTML or XML. The patient names
displayed with a red font fake rolex sale in the lower grid
is a method for indicating the patient has
allergies.
| |
| |
|